Sample report

See the output
before you talk to anyone

This is real output from our Azure Local demo cluster AZLCL01-CL, measured read-only on 6 October 2026. First the free first overview with the five heaviest points. Then what the Findings report of a ClusterTriage cluster assessment adds, for Hyper-V, Windows Server Failover Cluster, Azure Stack HCI and Azure Local.

The first overview

Five points, in plain language

The first overview comes from ClusterDown, our free read-only triage script. It ranks what it finds and reports the five heaviest signals. Below is the report for the demo cluster, unedited.

01 · HIGH

Azure Local solution update not healthy

The environment that installs Azure Local solution updates reports failed health checks, even though the last update itself applied successfully. While those checks fail, the next solution update may be refused or stop partway, which can leave the cluster behind on fixes and support.
02 · MEDIUM

FailoverClustering critical events in the window

The failover cluster logged critical events on both nodes in the last 90 days, which means the cluster itself recorded conditions it rates as serious. Such events can go together with workloads stopping, moving unexpectedly or a node leaving the cluster.

03 · MEDIUM

Event-log sizing of the critical channels

Some of the event logs that record what goes wrong are too small or switched off. During a burst of problems the oldest entries are overwritten first, so the record of how an incident started may be gone by the time someone looks for it.

04 · MEDIUM

Feature-update guard not set

Without this guard, both nodes can be offered a major feature update outside a planned change. A feature update that lands on a cluster node unplanned can change its behaviour or leave the nodes on different versions.

05 · MEDIUM

Hyper-V antivirus process exclusions missing

The antivirus on both nodes is not told to leave the Hyper-V processes alone. Scanning those processes can slow the virtual machines down or interfere with them starting and running.

The report also says what it could not read. On this run one event channel reached its limit and was read only in part, and the report states that at the top. At the time of measurement the cluster reported itself Unhealthy: both nodes were using more than 50% of physical memory.

From first overview to Findings report

What the cluster assessment adds

The first overview tells you where to look. The Findings report tells you what was measured, what it should be, how to repair it and how to prove the repair worked.

First overview (ClusterDown)Findings report (ClusterTriage)
ScopeThe five heaviest signals, here 5 of 12Every finding, prioritised, across host, cluster, storage, network and the modules around them
Per findingWhat was seen and what it can lead toThe measured value, the norm with its source, the deviation, the risk, the repair and the check afterwards
Judged byThe ranking of the scriptA specialist, in your situation
Follow-upYou decide what to do nextA one-hour review. With Assurance a delta and residual-risk report every quarter

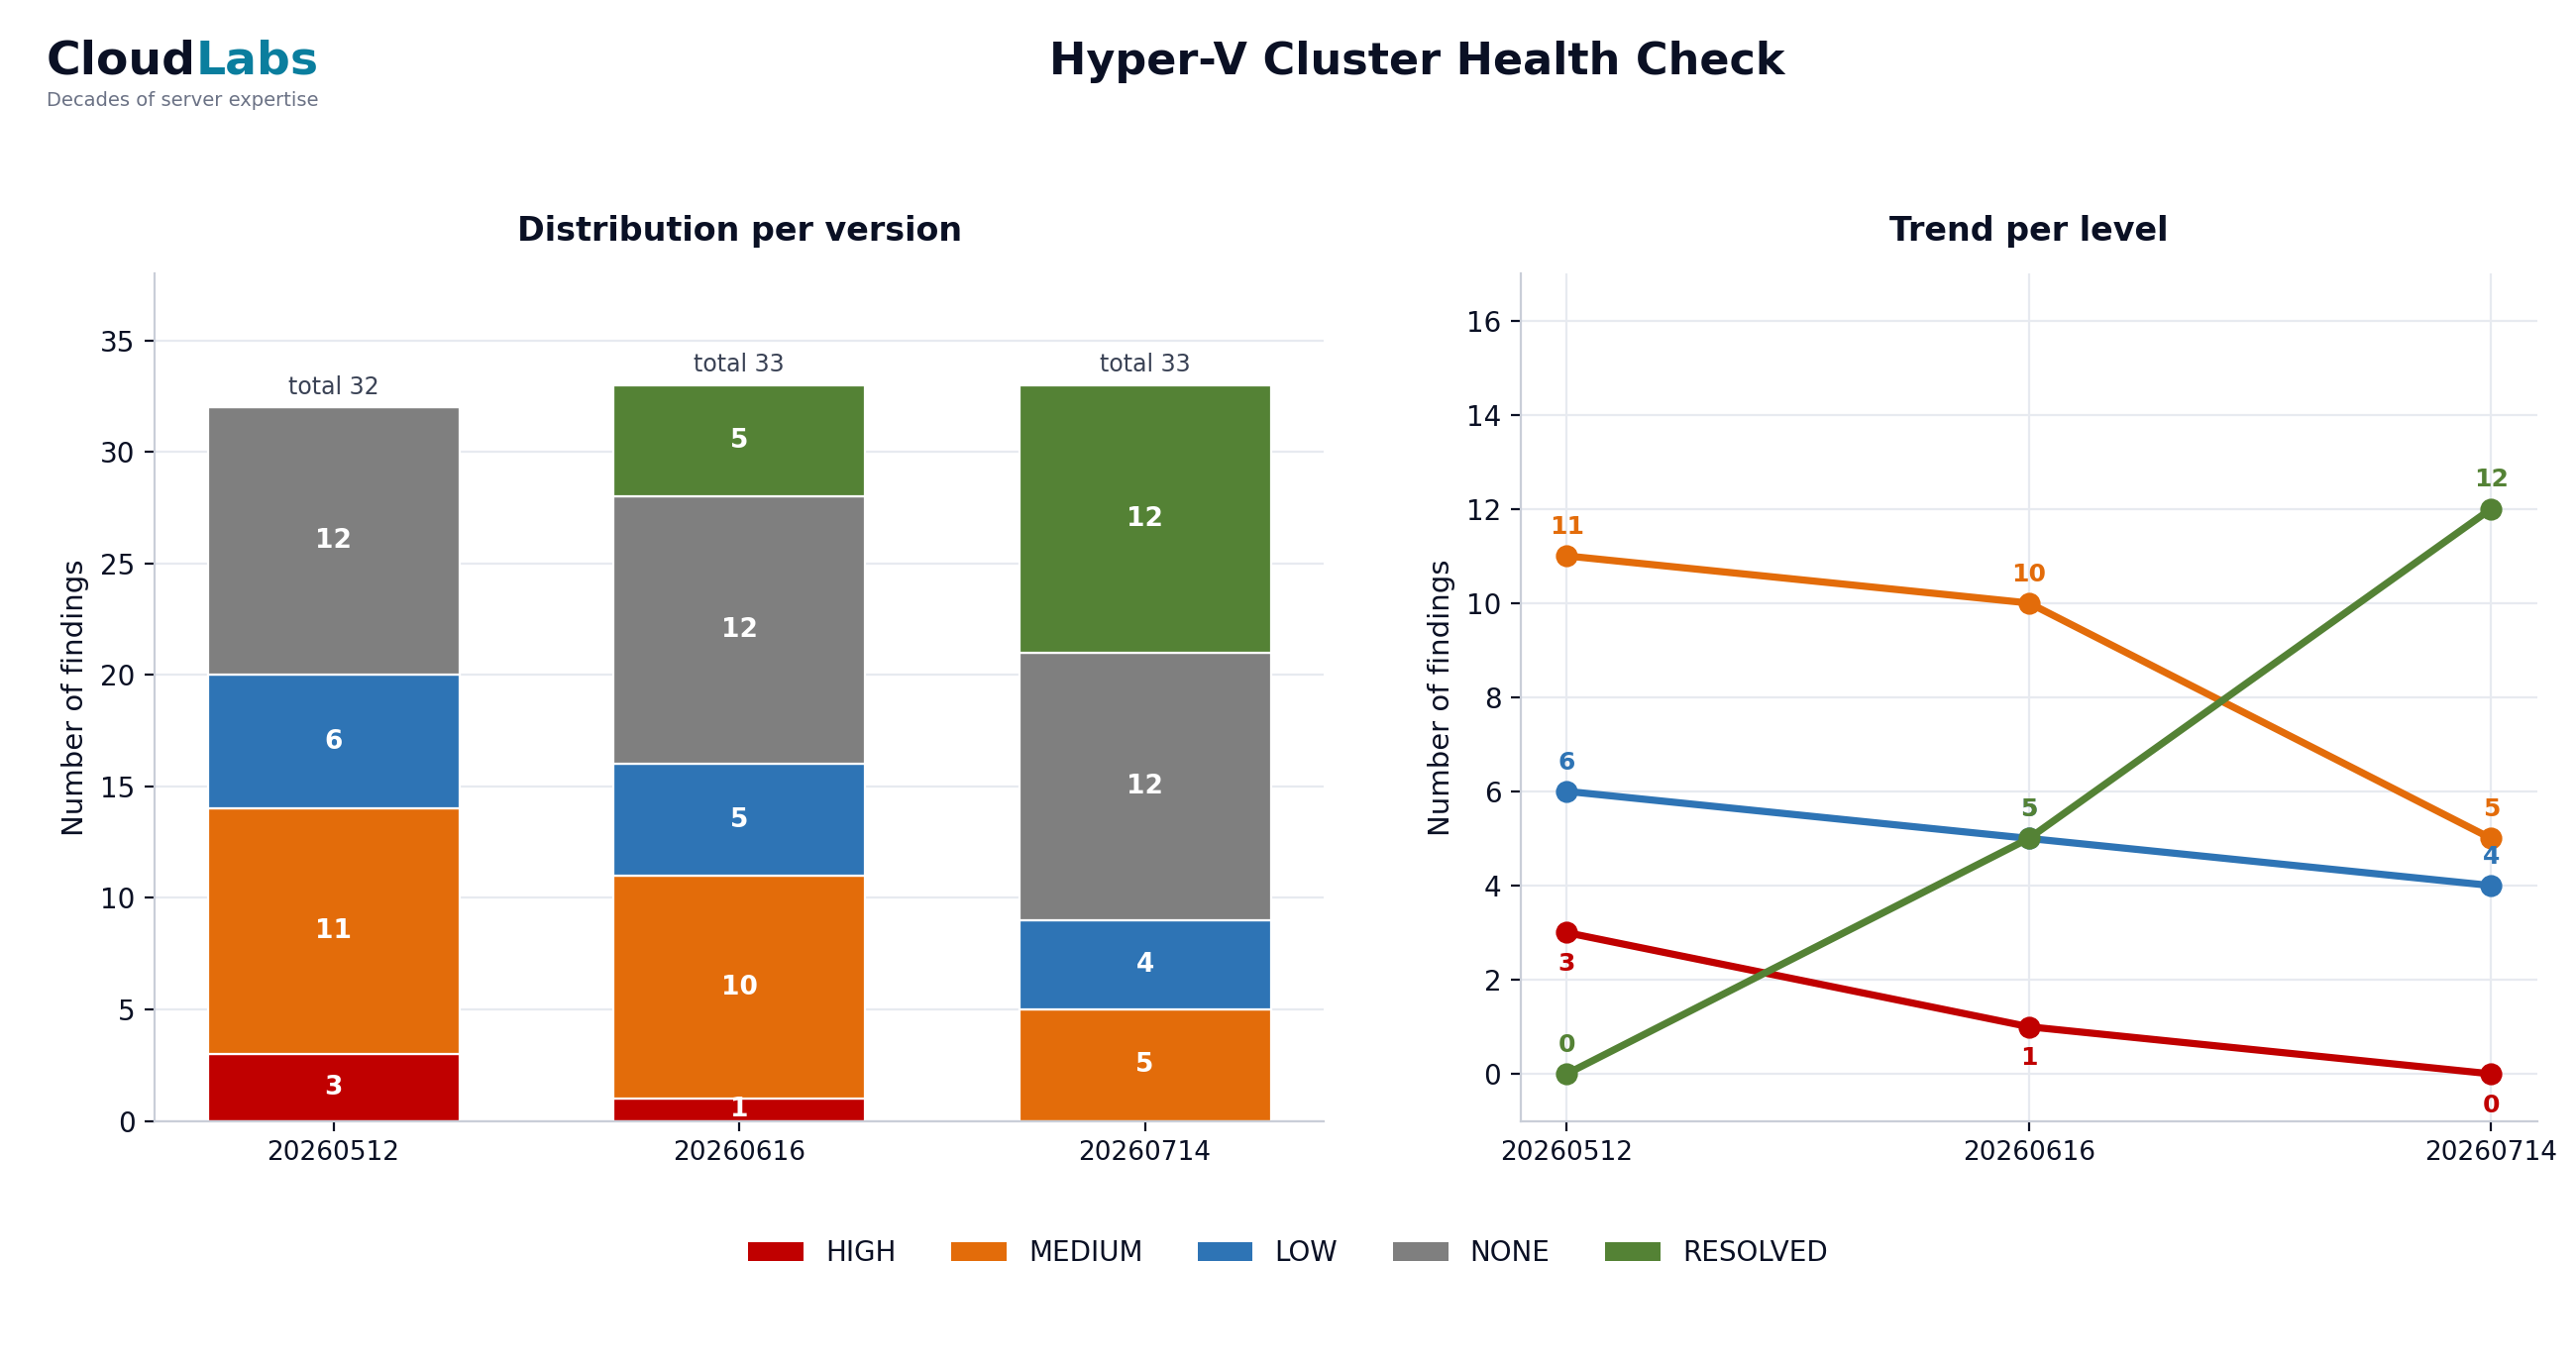
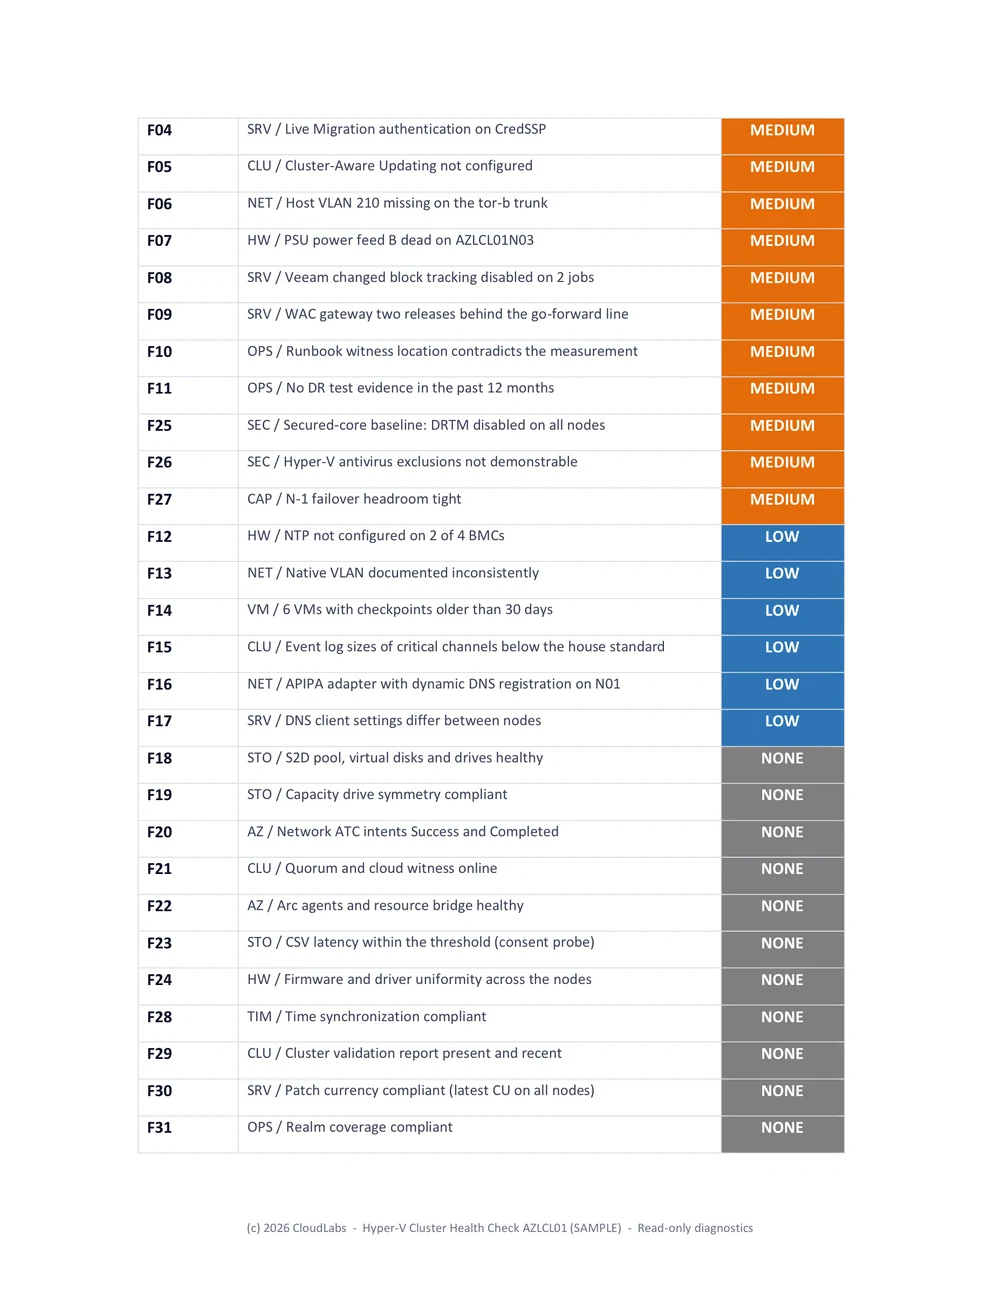
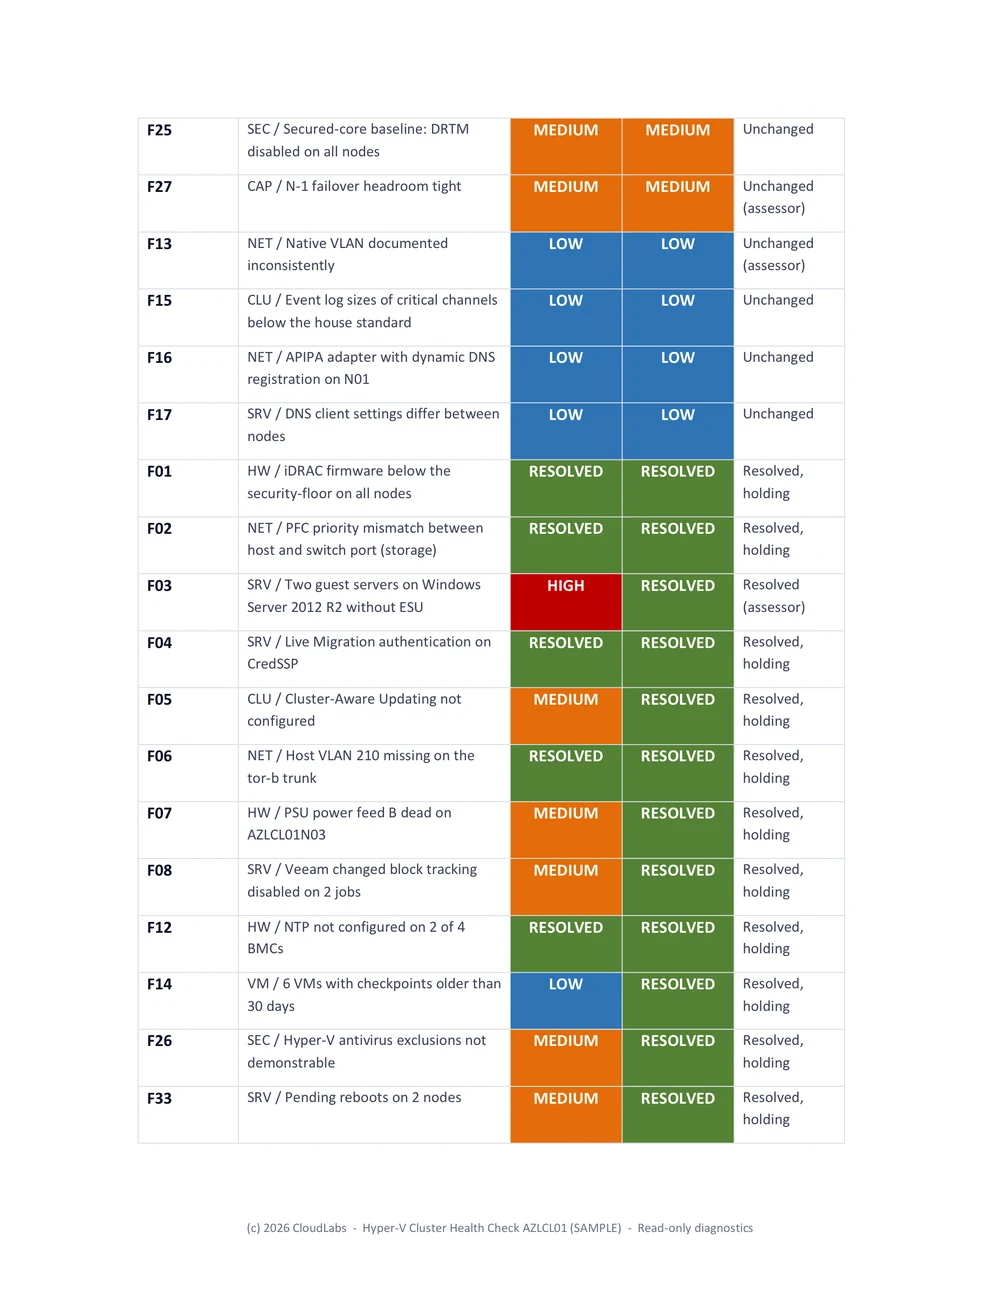
Pages from the reports

Read the full sample

Ask for the complete sample Findings report

Three details are enough. You receive the complete sample Findings report by e-mail and can read every finding with its repair and its check. No call needed.

Send via WhatsApp, or by e-mail to hans@clustertriage.com.

We aim to respond within one business day.
This form sends nothing by itself: the request leaves through your own WhatsApp or e-mail. This page stores nothing.

ClusterTriage

Rather talk it through?

Start with a conversation about your environment. From that follows which measurement makes sense.